


STATISTICS
MEASURES OF CENTRAL TENDENCY
An average or a central value of a statistical series is the value of the variable which describes the characteristic of the entire distribution. In other words an average of a distribution is the value of the variable which is representative of the entire distribution. Following measures are usually employed for central tendency :
- Mathematical Averages
- Arithmetic mean or Mean
- Geometric mean
- Harmonic mean
- Averages of position
- Median
- Mode
ARITHMETIC MEAN
ARITHMETIC MEAN FOR UNCLASSIFIED DATA
If n numbers be x1, x2, x3 ........ xn then their arithmetic mean
A or 
ARITHMETIC MEAN FOR FREQUENCY DISTRIBUTION
Let f1, f2, ........, fn be corresponding frequencies of x1, x2, .......xn. Then

ARITHMETIC MEAN FOR CLASSIFIED DATA
Class Mark of the class-interval a – b, 
For a classified data, we take the class-marks x1, x2, ...., xn of the classes as variables and

Deviation of a Term
If the variable be x and A.M. be A, then the deviation of x from A
d (or dx) = x – A
d (or dx) = x – A
USE OF SHORT-CUT METHOD IN COMPUTING ARITHMETIC MEAN
We take a number arbitrarily as the mean called the assumed mean (should be taken approximately in the middle of the greatest and the least values of the variable)
SHORT-CUT METHOD FOR SIMPLE DISTRIBUTION
Where, a = assumed mean, d = x – a, n = no. of terms
SHORT-CUT METHOD FOR UNCLASSIFIED FREQUENCY DISTRIBUTION

Where a = assumed mean, d = x – a, f = frequency of variable x
SHORT-CUT METHOD IN CLASSIFIED FREQUENCY DISTRIBUTION

Where a = assumed mean, d = x – a, x = class-mark of the class-interval, f = frequency of the class interval
STEP DEVIATION METHOD IN A CLASSIFIED FREQUENCY DISTRIBUTION
This is not an independent method for finding A.M. but it is an auxiliary method for short-cut method. In this method the class-intervals should be of equal lengths
 ,
,
Sometimes the values of di are divisible by a common number h (say). In such a case the calculation for arithmetic mean is reduced to a greater extent by taking  i = 1,2, ...., n
COMBINED MEAN
If x1, x2, ......, xr be r groups of observations, the arithmetic mean of the combined group x is called the combined mean of the observation
A = combined mean. Ar = A.M. of collection Xr
nr = total frequency of the collection Xr
ALGEBRAIC PROPERTIES OF A.M.
- The algebraic sum of the deviations of all the values of the variable from their mean is zero
- for simple distribution Σ (xi – A) = 0
- for frequency distribution Σ fi (xi – A) = 0
- The mean of the sum of two variables is equal to sum of their means. (True for more than two variables also)
- Let u and ν be two variables and w = bu + cν be a new variable, where b and c are constants. If the corresponding A.M. be B and C for the variables u's and ν's and A.M. of w's be A, then A = bB + cC
- The sum of the squares of the deviations of the variable is minimum when taken about A.M.
WEIGHTED ARITHMETIC MEAN
If ω be the weight of the variable x then the weighted A.M.  .
.
.
Short cut method :

aw = assumed mean,
Σ wd = sum of products of the deviations & corresponding weight
GEOMETRIC MEAN
If x1, x2, ......, xn be n values of the variable then
For Frequency Distribution  , where
or 
HARMONIC MEAN

For Frequency Distribution,  , where
, where MEDIAN
The median of a distribution is the value of the middle variable when the variables are arranged in ascending or descending order.
Median (M) is an average of position of the numbers
DETERMINATION OF MEDIAN
DETERMINATION OF MEDIAN FOR SIMPLE DISTRIBUTION
Arrange the terms in ascending or descending order and then find the number of terms n.
- If n is odd then
term is the Median
- If n is even then there are two middle terms namely,
Median = Mean of
DETERMINATION OF MEDIAN FOR UNCLASSIFIED FREQUENCY DISTRIBUTION
- First find
, where
- Find the cumulative frequency of each value of the variable and take value of the variable which is equal to or just greater than
- This value of the variable is the median
DETERMINATION OF THE MEDIAN FOR CLASSIFIED DATA
- Class limit and Boundary
Overlapping intervals, e.g. 10 – 20, 20 – 30, 30 – 40, ......
Upper limit for 10 - 20 interval = 20 Lower limit = 10
Non-overlapping intervals, e.g. 10 - 19, 20 - 29, .......
Upper boundary for 10 - 19 =  = lower boundary of 20 – 29.
- Median Class
If in a continuous distribution the total frequency be N then the class whose cumulative frequency is either equal toor is just greater than
is called median class.
For a continuous distribution, median

l = lower limit of the median class,
f = frequency of the median class
N = total frequency = 
F = Cumulative frequency of the class just before the median class
C = length of the median class
DETERMINATION OF MEDIAN BY GRAPH
We draw the “less than” ogive and “more than” ogive for the distribution. The abscissa of the point of intersection of these ogives is the median
QUARTILES
- The median divides the distribution in two equal parts. The distribution can similarly be divided in more equal parts (four, five, six etc.)
- The values of three division points which divide the distribution into four equal parts are called quartiles. If the first, second and third division values be Q1, Q2, Q3, they are called the first quartile, the second quartile and the third quartile respectively.
- If the distribution is arranged in ascending order, then clearly the first quartile will be greater than the
th variable but less than
th variable, the second quartile will be greater than
th variable but less than
th variable and the third quartile is greater than
th variable but less than Nth variable
Clearly the second quartile = Median
First quartile is also called lower quartile and the third quartile as upper quartile
TO DETERMINE QUARTILES FOR A CONTINUOUS DISTRIBUTION

N = total frequency
l = lower limit of the first quartile class
f = frequency of the first quartile class
F = the cumulative frequency corresponding to the class just before the first quartile class
C = the length of the first quartile class
Similarly 
where symbols have the same meanings as above only taking third quartile in place of first quartile
MODE
The mode (M0) of a distribution is the value at the point about which the items tend to be most heavily concentrated. It is generally the value of the variable which appears to occur most frequently in the distribution
MODE FOR A RAW DATA
Mode from the following numbers of a variable 70, 80, 90, 96, 70, 96, 96, 90 is 96 as 96 occurs maximum number of times.
MODE FOR UNCLASSIFIED FREQUENCY DISTRIBUTION
Here the greatest frequency is 13, which is the frequency of 5. So mode = 5
MODE FOR CLASSIFIED DISTRIBUTION
The class having the maximum frequency is called the MODAL CLASS and the middle point of the modal class is called the CRUDE MODE.
The class just before the modal class is called PRE-MODAL CLASS and the class after the modal class is called the POST-MODAL CLASS
Determination of mode for classified Data (continuous distribution)
l = lower limit of the modal class
f0 = frequency of the modal class
f–1 = frequency of the pre-modal class
f1 = frequency of the post-modal class
i = length of the class-interval.
IMPORTANT POINTS
- The length of intervals should be equal.
- Intervals should be overlapping. If it is not overlapping it should be changed to overlapping
- If more than one class has maximum frequency, then determine the modal class using grouping method
Sometimes, 2f0 – f–1 – f1 becomes zero. We then write
SYMMETRIC AND SKEW DISTRIBUTION
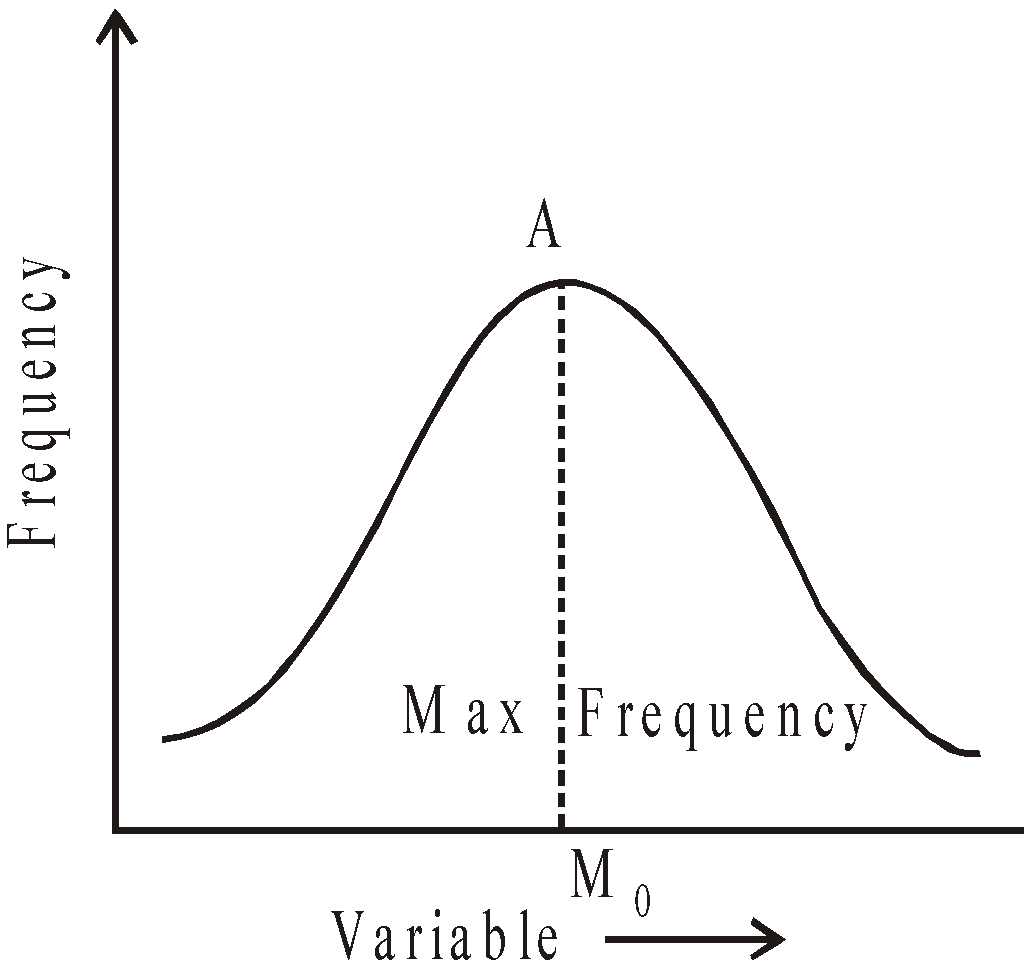
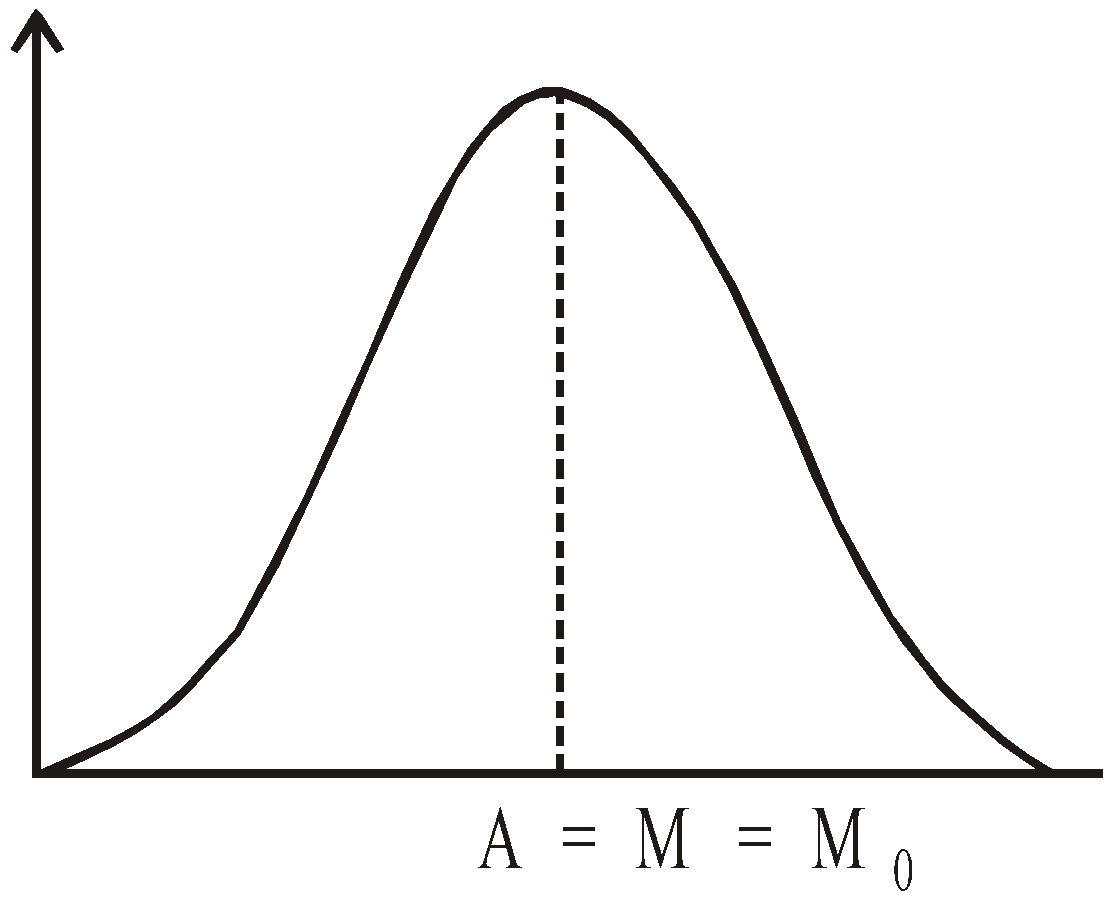
A distribution is symmetric if the same number of frequencies is found to be distributed at the same linear distance on either side of the mode. The frequency curve is bell-shaped and A = M = M0
In antisymmetric or skew distribution, the variation does not have symmetry
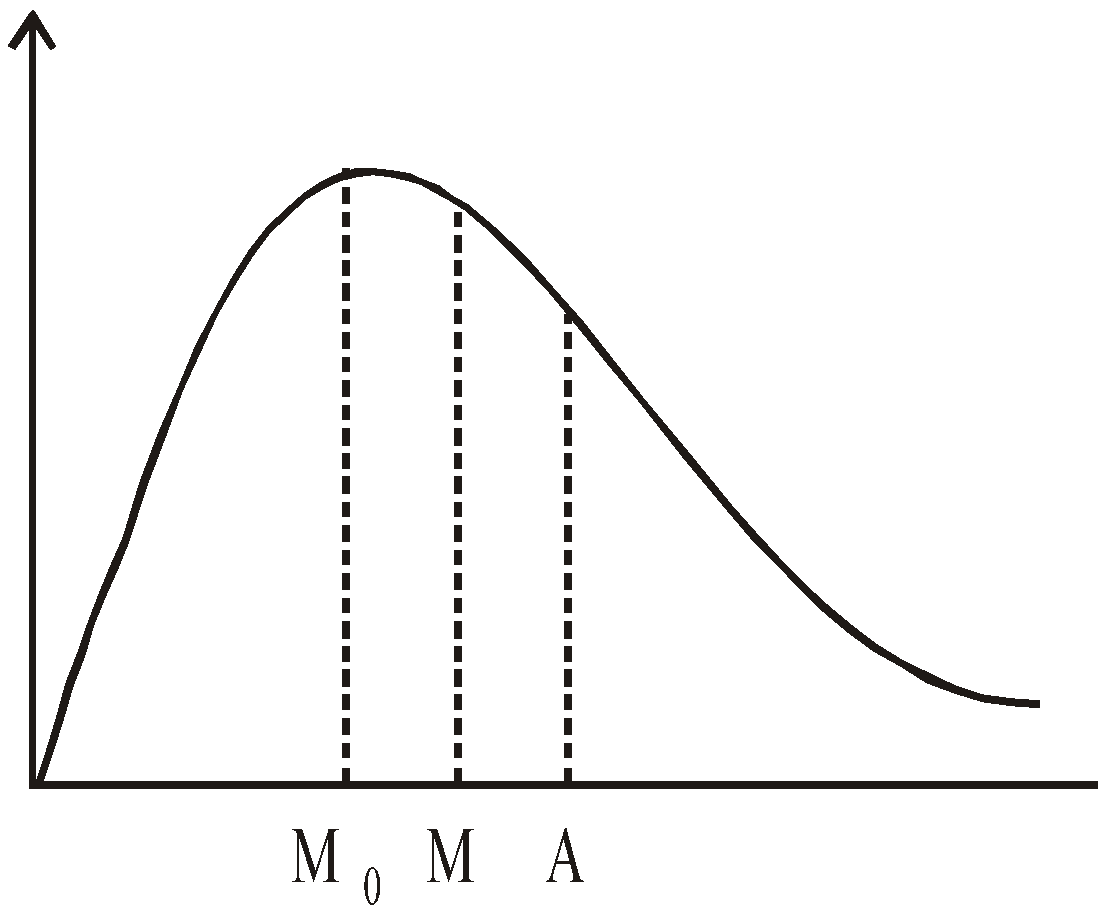
- If the frequencies increase sharply at beginning and decrease slowly after modal value, then it is called POSITIVE SKEWNESS and A > M > M0
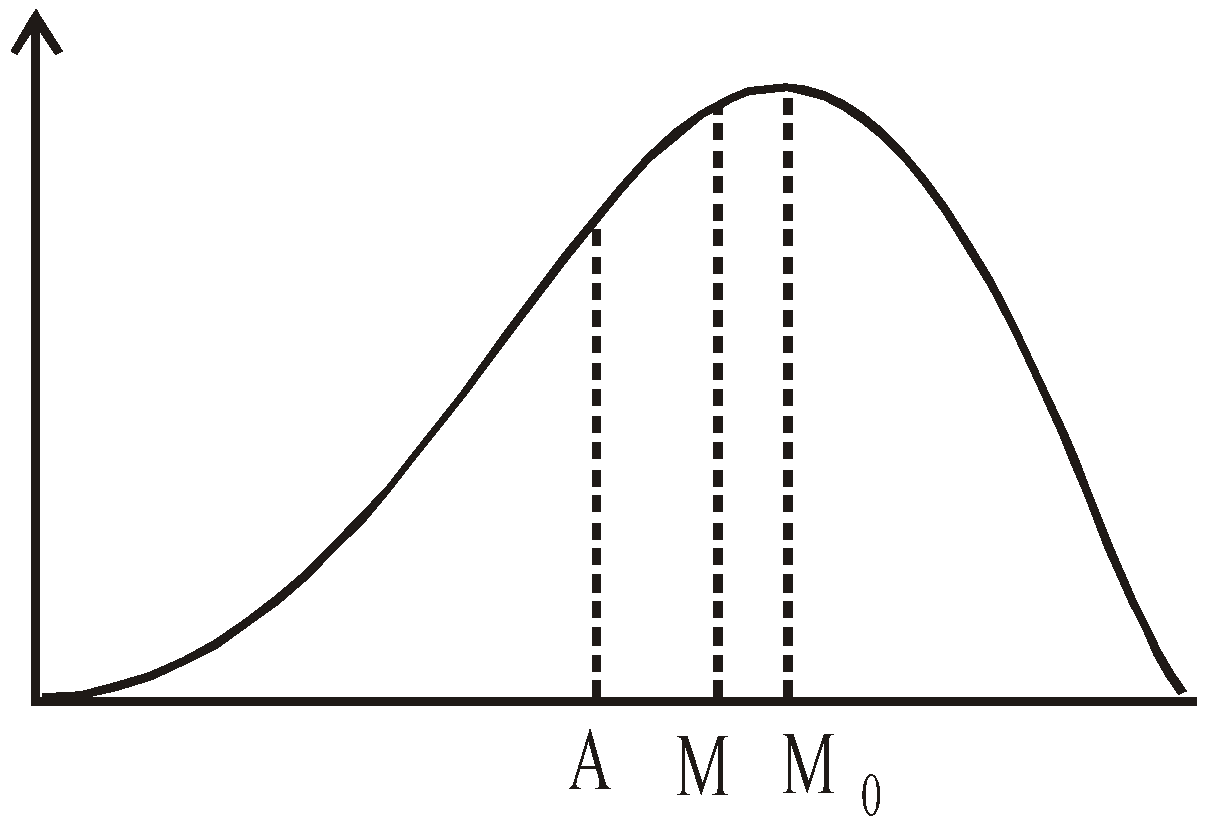
- If the frequencies increase slowly and decrease sharply after the modal value, the skewness is said to be NEGATIVE and A < M < M0
RELATION BETWEEN MEAN, MEDIAN AND MODE
For a symmetric distribution, M0 = M = A
For a moderately skewed distribution A – M0 = 3 (A – M)
This is an empirical formula and was first described by KARL PEARSON.
MEAN DEVIATION AND STANDARD DEVIATION
DISPERSION
The degree to which numerical data tend to spread about an average value is called VARIATION or DISPERSION of the data. (Its measurement is called DEVIATION)
Deviation of a term from a measure of Central Tendency
If the term = x and the mean = A, then deviation d or dx = x – A
 is called absolute deviation.
MEASURE OF DISPERSION
Popular methods are (i) Mean Deviation (ii) Standard Deviation
Popular methods are (i) Mean Deviation (ii) Standard Deviation
Some other methods are (iii) Range (iv) Quartile Deviation
MEAN DEVIATION (δ)
The arithmetic mean of the absolute deviations of the values of the variable from a measure of their either mean is called Mean Deviation (M.D.), denoted by  or
or  or
or 
- for simple (discrete) distribution
where n = no. of terms, z = A or M or M0
- for Unclassified frequency distribution

- for classified distribution

where x stands for class-mark
The mean deviation is the least when measured from the median.
COEFFICIENT OF MEAN DEVIATION
It is the ratio of M.D. and the mean from which the deviation is measured.
Thus the coefficient of M.D. =  or
or  or
or 
STANDARD DEVIATION (σ)
S.D.(σ) is the square root of the arithmetic mean of the squares of deviations of the terms from their A.M. i.e. standard division is the positive square root of variance
- For simple (discrete) distribution

- For frequency distribution

- For classified data :

where x = class-mark of the interval
IMPORTANT POINTS
- The square of S.D., i.e., σ2 is called the VARIANCE.
- The ratio of S.D. (σ) and the A.M. (A) is called the coefficient of standard deviation
.
- The percentage form of coefficient of S.D., i.e.
is called Coefficient of Variance.
- The distribution for which the coefficient of variance is less is called more consistent.
Root Mean Square Deviation (S)
The square root of the A.M. of squares of the deviations from an assumed mean is called the root mean-square deviation. Thus
- for simple (discrete) distribution

a = assumed mean
- for frequency distribution

if a = A, then S = σ
Short-cut method for S.D.

Where d = x – a and a = assumed mean
IMPORTANT POINTS
1. The RMS deviation is the least when measured from A.M.
2. The sum of the squares of the deviation of the values of the variables is the least when measured from A.M.
3. 
4. For discrete distribution f = 1, thus .
.
5. Above formula is a short-cut for finding σ.
Variance = 
6. The mean deviation about the mean is less than or equal to the S.D., i.e.,
STEP DEVIATION METHOD

Where c = length of interval and 
This method makes the calculation simpler and it is used primarily in case of classified frequency distribution.
Study Notes for JEE Main/JEE Advanced/BITSAT


